
Airbnb Occupancy Rate Calculator by City: How to Find Your Real Number in 2026
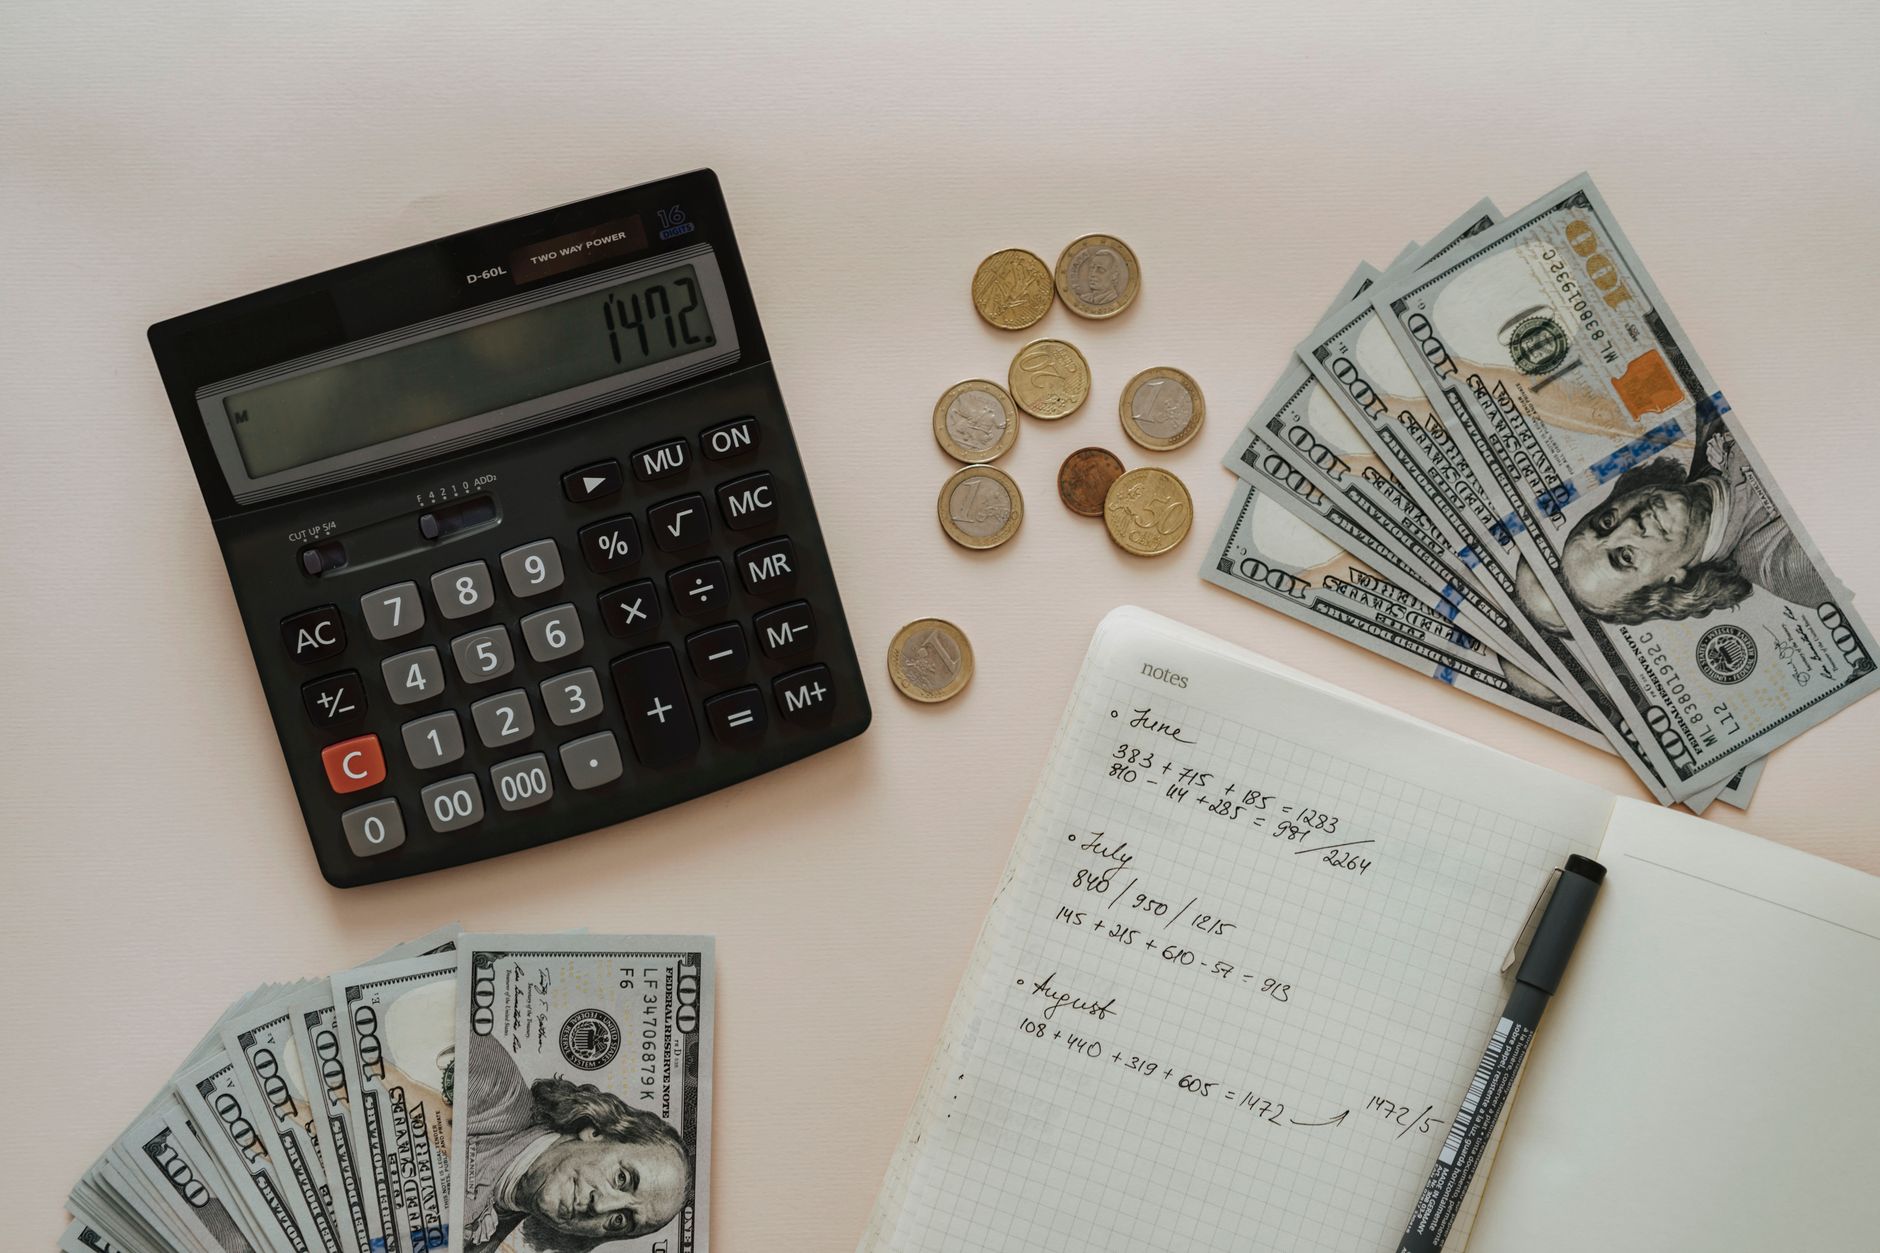
Summer 2026 just wrapped, and the numbers are in: with World Cup host cities like Los Angeles, Miami, and Dallas posting occupancy spikes above 90% in June and July, hosts everywhere else are asking the same uncomfortable question — is my listing actually performing, or am I leaving money on the table? That’s exactly where an Airbnb occupancy rate calculator by city becomes your most valuable tool. Not a generic national average. Not a gut feeling. A city-specific benchmark that tells you whether 65% occupancy in your market is crushing it or quietly bleeding revenue.
In this guide, you’ll learn how occupancy rate calculators actually work, where to find reliable city-level data in 2026, how to run the math yourself in under five minutes, and — most importantly — what to do when your number falls short.
What an Airbnb Occupancy Rate Calculator by City Actually Measures
At its core, occupancy rate is simple: booked nights ÷ available nights × 100. If your listing was available 30 days last month and booked for 21, your occupancy rate is 70%.
But here’s where most hosts get it wrong. A raw number means nothing without context. A 55% occupancy rate in a seasonal beach town during February might be excellent. That same 55% in downtown Austin during South by Southwest season? You’re underperforming by 25 points.
A city-specific calculator layers in three things a napkin calculation can’t:
- Seasonality curves — how your market swings month to month
- Property-type benchmarks — a studio and a 4-bedroom house have very different “normal”
- Booking window data — how far ahead guests in your city actually book
The best calculators in 2026 pull from scraped listing data, host-reported figures, and platform APIs to give you a percentile ranking — telling you whether you’re in the top 25% of your market or the bottom quartile.
Where to Find Reliable City-Level Occupancy Data in 2026
Not all data sources are created equal. Here’s what experienced hosts actually use:
AirDNA remains the heavyweight for market-level data. Their Market Minder tool shows occupancy by city, neighborhood, and bedroom count, with historical trends going back years. Expect to pay around $20–$50/month depending on the market size.
Mashvisor offers occupancy estimates alongside cap rate calculations — useful if you’re evaluating a new market before buying, not just benchmarking an existing listing.
PriceLabs Market Dashboards are the sleeper pick. If you already use PriceLabs for dynamic pricing, their market dashboards show real-time occupancy pacing for your comp set at no extra cost. You can see not just where occupancy is, but where it’s heading 30, 60, and 90 days out.
Free alternatives: Airbtics offers limited free city reports, and local STR Facebook groups often share anonymized occupancy screenshots. Treat these as directional, not gospel — self-reported data skews optimistic because struggling hosts rarely post their numbers.
One 2026-specific caveat: verify whether your data source has normalized for World Cup host city anomalies. Some tools are still showing inflated “average” occupancy for cities like Atlanta and Seattle based on event weeks that won’t repeat.
How to Calculate Your Occupancy Rate the Right Way
Before benchmarking against your city, make sure your own number is honest. Three mistakes distort the math:
Mistake 1: Counting blocked dates as unavailable. If you blocked two weeks for a family visit, exclude those nights from your denominator — but also ask yourself whether that block cost you $2,000 in peak-season revenue.
Mistake 2: Ignoring orphan gaps. A listing booked 18 of 30 nights sounds like 60% occupancy. But if those 18 nights are scattered in 2-night chunks with unbookable single-night gaps, your effective availability was lower. Tighten your minimum stay settings to reduce fragmentation.
Mistake 3: Comparing monthly to annual. Calculate a rolling 12-month occupancy rate to smooth out seasonality, then compare month-over-month against your city’s curve.
The clean formula:
True Occupancy Rate = Booked Nights ÷ (365 − Intentional Owner Blocks) × 100
Run this quarterly. A host in Nashville who did this in early 2026 discovered her “healthy” 68% annual occupancy masked a disastrous 41% in January–March — a fixable problem once she saw it clearly.
Benchmarking: What Good Occupancy Looks Like by Market Type
City averages vary wildly, but 2026 data reveals consistent patterns by market type:
- Major urban markets (New York, Chicago, San Francisco): 70–80% is strong; below 60% signals a pricing or listing quality problem
- Drive-to leisure destinations (Gatlinburg, Gulf Shores, Branson): 55–70% annually, with extreme seasonal swings
- Business travel hubs (Charlotte, Columbus, Indianapolis): steady 65–75% with weekday-heavy bookings
- Event-driven markets: baseline occupancy of 50–60% punctuated by 95%+ event weeks
The most useful benchmark isn’t the city average — it’s the 75th percentile for your specific property type in your specific neighborhood. If the top quartile of 2-bedroom condos in your area runs 78% occupancy and you’re at 61%, that 17-point gap represents roughly $9,000–$14,000 in annual revenue for a typical $180/night listing.
What to Do When Your Occupancy Falls Below Market
Diagnosis before prescription. Low occupancy almost always traces to one of four causes:
1. Pricing misalignment. If your occupancy is 15+ points below market AND your average daily rate is above the median, you’re priced out. Drop 8–12% and watch booking pace for three weeks.
2. Visibility problems. Check your impressions in Airbnb’s host dashboard. Low impressions with decent conversion means the algorithm isn’t showing you — usually a review velocity, response time, or listing freshness issue.
3. Conversion failure. High impressions, low bookings? Your photos, title, or reviews are losing guests at the click-through stage. This is a listing quality problem, not a pricing one.
4. Market oversaturation. Sometimes the honest answer is that your city added 2,000 new listings in 18 months. In that case, differentiation — pet-friendly, workspace-optimized, longer-stay discounts — beats discounting.
Your Next Step
An Airbnb occupancy rate calculator by city isn’t a report card — it’s a diagnostic tool. Pull your true 12-month number this week, benchmark it against the 75th percentile for your property type in your market, and identify which of the four failure modes applies to you. Then make one change — a price adjustment, a photo refresh, a minimum-stay tweak — and measure for 30 days. The hosts who consistently outperform their city’s occupancy average aren’t lucky; they’re just measuring what everyone else is guessing at.